
Quantitative Information Literacy: Designing an Online Course at the Interface between Information Literacy and Statistical Literacy1
Summary:
Information literacy has become a large topic in libraries while statistical literacy is at most of secondary concern in library services. The article introduces the design of the online self-learning course „Daten und Statistiken recherchieren und nutzen“ („Searching and using data and statistics“) at the Duisburg-Essen University Library to show how an online course may fill the gap between reference services and courses about statistical methodology. With emphasis on the responsible librarians’ perspective and especially the didactical analysis and decisions, it is installed as a numerical data service similar to subject guides. By using the learning management system Moodle, the course addresses students who study economics, political, or social sciences and plan to write an empirical paper.
Zusammenfassung:
Während sich die Informationskompetenzunterstützung in unterschiedlichen Dienstleistungsausprägungen in Bibliotheken etabliert hat, spielt das Komplement Statistikkompetenz dort höchstens eine untergeordnete Rolle. Der Aufsatz erläutert die Erstellung des Online-Selbstlernkurses „Daten und Statistiken recherchieren und nutzen“ an der Universitätsbibliothek Duisburg-Essen und zeigt, wie ein solcher Onlinekurs eine Brücke zwischen den beiden Kompetenzen und insbesondere den Auskunftsdiensten der Bibliothek und der statistischen Methodenlehre schlagen kann. Der Aufsatz berücksichtigt vor allem die Anwendersicht unter Bezug auf die didaktischen Analysen und Entscheidungen beim Design des an Subject Guides/Forschungsführern orientierten Moodle-Kurses für die Zielgruppe Studierende der Wirtschafts-, Sozial- und Politikwissenschaften.
1. Introduction, background, and project framework
„Statistical information is one of the best ways we have of making sense of the world’s complexities, of identifying patterns amid the confusion. But bad statistics give us bad information“.2 So why not implement library services at the interface between information literacy and statistical literacy offered by information professionals?
Numerical information is increasingly presented in our daily and scholarly life: Advertising adds statistics persuading the target group to buy a specific product or to use a specific service, the news use key figures like the consumer price index, and scientific papers try to prove or disprove hypotheses by estimating models. This mass of statistical information led to two extreme attitudes towards statistical information: The negative extreme follows the title of Best’s „Damned lies and statistics“, expressed in distrust of statistics3 while the positive4 extreme is simply to trust in the truth and objectivity of numbers. As it always was, extremes do not embody the truth and especially, if generalizing the statement for statistical information, the great truth does not exist. Still, libraries, which already assist in developing critical thinking with respect to textual information literacy, can act as multipliers for the whole set of statistical information and therefore promote critical thinking also with respect to statistical information.
The idea of including statistical literacy into library services as presented in this paper is rooted in the service orientation of Bielefeld University of Applied Sciences Library’s working group Learning Services.5 As so called Learning Service, the face-to-face workshop „Alltagsstatistiken hinterfragt“ („questioning everyday statistics“) was held in 2016 with positive feedback regarding the structure and topics covered. Building on these experiences, Duisburg-Essen University Library decided to take the matter up again in form of an online course. The online course was developed within the study program of MALIS – Master of Library and Information Sciences6 – at Technische Hochschule Köln supervised by Professor Doctor Inka Tappenbeck. Nevertheless, the course will be promoted, evaluated, administrated, and updated, because it is considered to complement the service portfolio of Duisburg-Essen University Library. Moreover, the presentation of the Bielefeld University of Applied Sciences Library’s workshop at the 6th Library Congress in 2016 demonstrates that the content of the course is a hot topic.7
The objective of this online course is to generate a new service for a specific sub-target group of Duisburg-Essen University Library to complement existing reference services in the field of „quantitative information literacy“ (QIL). The target group are students of economic, political, and social sciences who plan to write an empirical paper but already know the statistical methodologies and the principles of scientific writing with respect to textual information.
Beginning by showing the overlap of information literacy and statistical literacy which is defined as QIL, a short overview of reference and numeric data services is presented. On this basis, the course design is introduced with a focus on the didactical analyses and decisions. Following this, the realization and status of the project are critically reflected. The article concludes with a short summary and outlook.
2. Information literacy versus statistical literacy in the library context
Information literacy has become an important topic in libraries and especially in the context of student services of college and university libraries in the last decades:8 In 2000, the Association of College and Research Libraries, a division of the American Library Association, published the „Information Literacy Competency Standards for Higher Education“ 9 as a guideline for designing library services supplemented by resources of the Student Learning & Information Literacy Committee.10 At about the same time standards were put into writing in the United Kingdom11 and in Australia12, while in Germany the standards of information literacy for students were presented in 2009.13 Though libraries have already given advice in research and information use well before the turn of the millennium, those papers first fixed the idea of information literacy and especially the involved competencies. Summing up those standards, information literacy combines the abilities of (a) formulating information needs, (b) mapping out efficient research strategies linked to knowledge of research sources, (c) evaluating information, the research process and progress, (d) processing and handling of information, and (e) the ethic, legal, and socioeconomic implications of information use.14
A common opinion about statistical literacy is not yet fixed on the national level. On the international level, the International Association for Statistical Education15 initiated the International Statistical Literacy Project „to promote statistical literacy across the world and in all walks of life“, also considering the role of libraries.16 In this project the five skills summarized in the term „statistical literacy“ are (i) „knowledge of basic statistical key figures“, (ii) „understanding concepts describing society (e.g. inflation, unemployment, GDP, etc.)“, (iii) „basic information about research methods (from the viewpoint of both use and interpretation)“, (iv) „basic information about visualization (both about visualization and interpretation)“, and (v) „knowledge about data sources and the ability to evaluate the used data sources“.17 Hence, statistical literacy combines both statistical methodological skills expressed in formulas and calculations – as those are the basis of statistics – and information literacy skills when it comes to searching, using, and evaluating statistical information. The responsibility of libraries to support in acquiring those skills is also reflected by Wallmann’s definition of statistical literacy: „Statistical Literacy is the ability to understand and critically evaluate statistical results that permeate our daily lives“.18 The key words in this definition are „evaluate“ and „daily lives“. Libraries will and should never be the institution in charge of offering lessons in statistical methodology, but libraries should focus on developments in media, which implies responding to the information needs of their target groups that are confronted by a flood of textual as well as quantitative information. Nuerk, Engel, and Martignon interpret statistical literacy with the terms reading and describing of statistics rather than computing.19 Shield even supports a library service triangle of the three complements information literacy, statistical literacy, and data literacy as it holds that „data literacy is needed to access, manipulate and summarize the data; but statistical literacy is needed to guide in that process while information literacy sets the overall context for evaluating the sources of data and the appropriate manipulations“.20 Therefore, in the context of library services, statistical literacy is more about statistics as a language and stylistic device supporting textual information.21 Altogether, statistical literacy overlaps with information literacy in the field of QIL. But do libraries really miss out on including services to improve their clients’ statistical literacy?
3. Reference services versus numeric data services
Libraries summarize an expanding service portfolio under the heading of reference services. Reference librarians assist in finding information with regard to a specific topic, printed and non-printed, via the library catalogue, in databases or in the world wide web, obviously associating the term information with a focus on the written word rather than on numeric data. Although, statistics is the science of methods to handle quantitative information22, which implies that statistics is only a specific type of information. This is consistent with the fact that „librarians traditionally collected statistical abstracts, census tabulations, economic indicators, vital statistics, and a wide range of other statistical information.“23 The digital age has transformed this information from printed to electronically available and hence increased accessibility.
The world wide web lists a range of American and Australian library guides about finding and using statistics (e.g. „Finding Data & Statistics“24 by UC San Diego Library, „Resources for Data Analysis“25 by Northwestern University Library, „Statistics: Getting started“26 by Curtin University Library or even statistical software tutorials as of Kent State University Libraries27) and British libraries like the Oxford Brookes University Library28 and the House of Commons Library publish the so-called „statistical guides“29. Moreover, the need to foster QIL is pronounced by international organizations30 and statisticians (e.g. Krämer and Shield). Additionally, teaching statistical literacy is based on information professionals’ competencies, because „[librarians] are generalists, not specialists. Their focus is not the focus of a particular discipline. As such they are eminently qualified to teach students how to think critically, how to become information literate, how to become statistically literate, and how to become data literate“.31 This stance being taken by Shield is consistent with the strategic objectives of the services of Duisburg-Essen University Library. Thus, the following chapter presents the didactical analysis and decisions with regard to designing its online course as a link between information literacy and statistical literacy.
4. Didactical analyses and decisions
When designing an online course, one has to take into account the underlying didactics, technical circumstances, and the presented content. Those three elements are summarized under the heading „Didactical analysis and decisions“, since they are mutually dependent and hence shape the overall course design.
Based on the chosen concept, the didactical analyses begin by defining the conditions (stakeholders and environment) which directly influence the teaching/course content and the educational objectives. Following these analyses, the decisions relating to the course content, the didactical theory, and the media used are made.32
4.1. Concept
The course is based on the idea of subject guides that are „lists of resources created by librarians to assist students with their research needs. These list[s] of resources may include topics including but not limited to books, journals, databases, websites, as well as any other topics the librarian feels would assist students with their research.“33 This main foundation implies that the course will primarily offer references and only use self-made content to embed those references in a structured manner and to connect seemingly unrelated tools like databases and statistical software.
The target group includes students of the economic, political, and social sciences. In 2014, the number of students at the University of Duisburg-Essen amounted to 3,172 for the Faculty of Social Sciences (including the political, social sciences, and East Asia studies), 5,470 for the Faculty of Economics and Business Administration (Campus Essen, including Business Information Systems and Computer Science), and 2,984 for the Mercator School of Management (Campus Duisburg, including Business Education).34 The group is relatively homogenous when it comes to topics in numerical databases, e.g. the World Bank’s World DataBank35 is of interest for economists with a focus on measuring economic growth by per capita income, for political scientists to evaluate a country’s openness to trade by tariff and non-tariff barriers and for sociologists in the field of educational research. Still, presenting only one database in detail using face-to-face training implies a minimum number of users with the same interests. Moreover, databases and especially the interface is particularly frequently updated. Database providers increasingly offer video tutorials themselves. At the same time the information in a specific database is limited and, hence, only a small part of the already small target group each term will be interested in this database. Due to these facts, instead of focusing on a specific database, materials supporting the process of scientific work which are part of the digital and printed collection of the library or available online for free are presented in the course. If questions with regard to an individual research should still arise, the subject librarian may give face-to-face advice referring to specific database issues. With this in mind, the librarian acts as information broker who is not creating but collecting, pooling, aggregating, and presenting information to support the empirical research process.
The major advantage of the online course is that students can use it independent of location and time. Furthermore, librarians at the reference desk can recommend the course to users and can look up information in the course themselves in order to answer a library user’s questions.
4.2. Inclusion of stakeholders
With respect to project management in general, one has to be aware of the project’s stakeholders and their interests. Designing an online course at a university library is not only influenced by the target group, but the online course will also attract the attention of lecturers teaching statistical methodology and practice. To prevent rejection of the course and, hence, causing the project to fail, the lecturers have to be involved by contributing to concerting the course content. This was done in an early phase of the course design after structuring and developing ideas on how to implement the concept. A second and final feedback was requested after the finalization of the course, so lecturers were able to evaluate the final product, propose final modifications, and will now promote the course because they trust in the information presented. This leads to the second stakeholder group – the target group – who will finally use the course. As the project was designed following a short timeframe, it was not possible to directly survey the students’ needs. Still, to get an idea of the students’ needs, experiences were collected (i) of reference librarians at Duisburg-Essen University Library and Bielefeld University of Applied Sciences Library referring to user requests, (ii) of subject librarians at Duisburg-Essen University Library, (iii) of lecturers involved in the project „Optimierung von Studienverläufen“ (optimizing students’ course of study) at Bielefeld University of Applied Sciences, and (iv) of the project lead based on the requests while writing her own empirical papers during her studies. Additional stakeholders are the library management, because the course reflects a diversification of the service portfolio of the library, and the computing center of the university, since software tips linked to specific services of the computing center are presented in the course.
4.3. Content
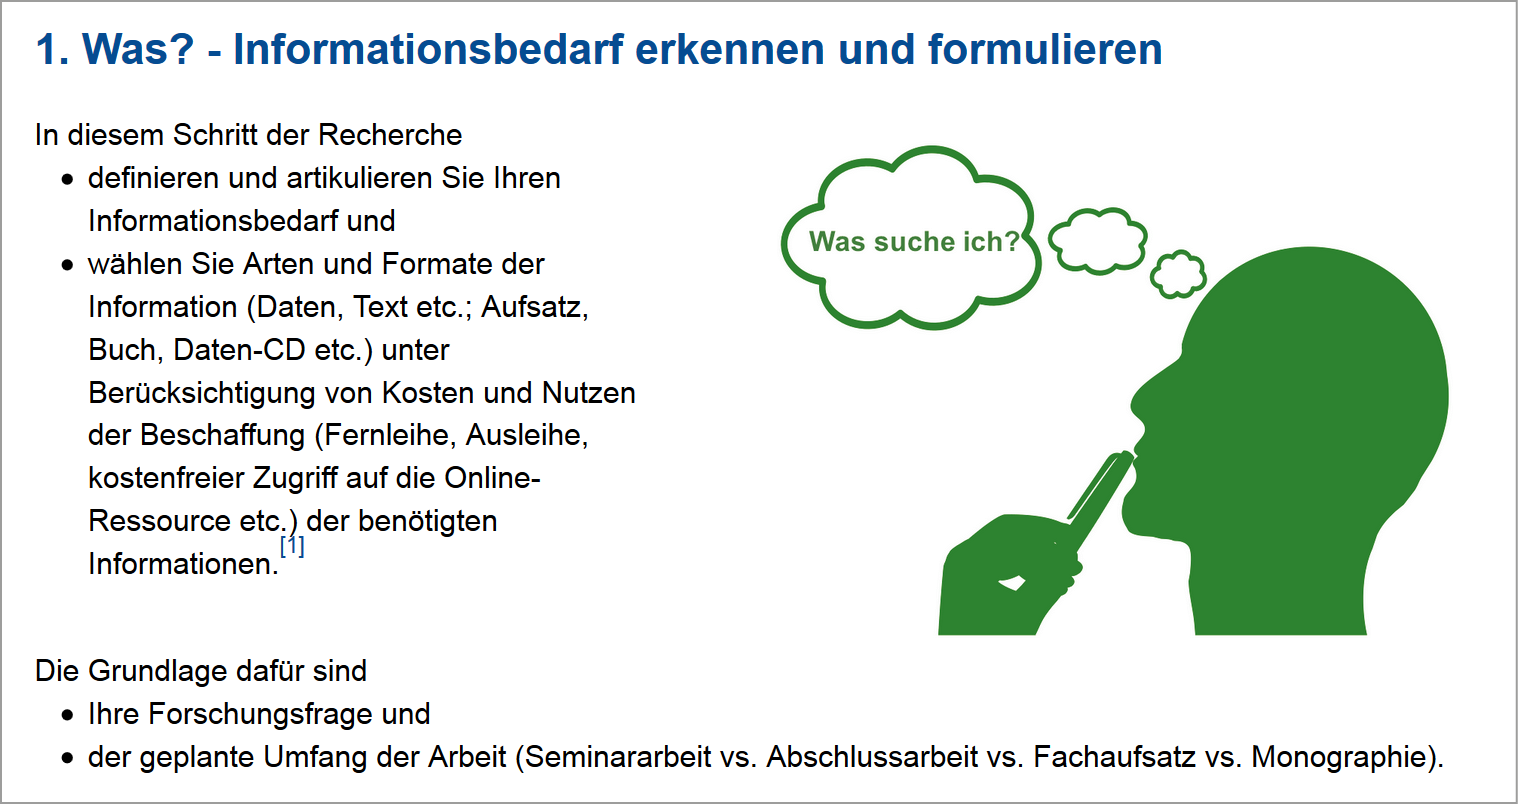
The content and structure of the course is based on Homann’s dynamic model of information literacy36 with a focus on statistical information and introduced by five key questions:
(1) Which purpose does statistical information serve and how can I make use of it? (Information needs)
(2) Where do I find statistical information and how can I access it? (Information sources and information access)
(3) How can I assess statistical information? (Information assessment)
(4) How can I process and present statistical information? (Information processing and presentation)
Students are able to select the section that best fits their information needs at the specific stage of the scientific working process.
The section covering the step „information needs“ serves as a kind of appetizer with regard to the use of statistical information.
The unit about information sources and information access lists numeric databases spanning the subject areas economics, political, and/or social sciences with respect to the target group in a wiki format. Additionally, a Moodle session about searching for data in general and accessing data e.g. via download and by using the provided metadata completes the self-made course elements in this section. Furthermore, links to tutorials enrich the information given as answer on key question (2).
In section (3), the Moodle session „Assessing usability“ presents guidelines for assessing information with respect to statistics. These include the six criteria authority, currency, purpose, target group, coverage, and content (which is the statistical method, its accuracy and relevance regarding the topic of the student’s paper) as in Standard Three of the Association of College and Research Libraries‘ Information Literacy Competency Standards for Higher Education.37 The section is completed by external video tutorials, a collection of materials including examples to check for these criteria and a list of recommended subject-specific literature on the evaluation of empirical information.
Finally, the unit on information processing and presentation starts with a session on data management, followed by a tools-wiki which covers information about popular statistic visualization tools, writing tools, software, a contact for software support at the university and a collection of tutorials and references linked to the library collection.
Supportive literature regarding the implementation of numeric data services is provided by Geraci, Humphrey and Jacobs, Kellam and Peter, and Haack, whose ideas have been incorporated into the course outline.38
4.4. Didactical theory
The didactical theory takes into account the complements theory of learning and motivation issues, which are presented in the following subchapters.
4.4.1. Theory of learning
According to Piaget, people learn through assimilation of knowledge by connecting new and existing knowledge and through accommodation by the modification of existing knowledge based on new knowledge.39 Derived from the concept of e-learning, direct instruction in form of multimedia-directed learning pertains to constructivism.40 The theory describes learning-teaching situations as autonomous finding and construction of issues, with a focus on creating authentic conditions41 instead of simply providing knowledge. This is consistent with the idea of a self-study online course independent of classes and of the students’ stage of studies. Instead of sequential learning steps that build on one another, the holistic learning environment concentrating on the individual user requirements goes hand in hand with learning objectives developed during the process.42 Still, those learning objectives should be derived from taxonomy. For describing professional and methodological competencies, Bloom’s taxonomy referring to the cognitive domain fits with the topic of this online course. This taxonomy classifies six stages that build on each other and refer to different levels of complexity: (1) Knowledge, (2) comprehension, (3) application, (4) analysis, (5) synthesis, and (6) evaluation.43 Due to the course content presented and the underlying concept, the course will hardly cover the levels analysis, synthesis, and evaluation. Instead, the course can transfer declarative knowledge, while the accumulation of procedural knowledge happens autonomously alongside the course, e.g. during the discovery of the presented databases and doing exercises.44
Accordingly, the underlying learning objectives of the online course are
(1) Knowledge: The user is able to recall or recognize …
a. the relevance of statistical information as a stylistic device in texts,
b. (access to) sources of statistical information,
c. effective and efficient search options regarding statistical information,
d. criteria for evaluating statistical information.
(2) Comprehension: The user is able to …
a. give examples for data providers,
b. identify metadata of numeric data and datasets,
c. describe the retrieval strategy adopted,
d. indicate the usability of a given statistical resource.
(3) Application: The user is able to …
a. choose from a set of databases with respect to the research question,
b. conduct a search for data/statistics.
Although the course presents evaluation criteria and software to organize and manipulate data or generate statistics with regard to the taxonomy levels analysis, synthesis, and evaluation, it neither directly facilitates practicing nor allows users to self-test these skills.
4.4.2. Motivation and online-self-learning
Apart from learning objectives and methods, online courses provide media to visualize content and methods that influence the user’s individual learning objectives.45 In this context, Niegemann emphasizes the importance of self-regulation and the relevance to motivate the user.46 Three elements influence the user’s motivation: (1) The social environment and (2) the requested level of competence have an impact on the intrinsic/extrinsic motivation, while (3) self-determined learning in addition to intrinsic motivation increases the effectiveness of learning.47 Here, parallels can be drawn between self-determined and discovery learning with a focus on tasks instead of content.48 Though the online tutor’s possibilities are limited due to his/her physical absence, the presented online course takes at least one out of those three motivation factors into account: The course provides the necessary scope for self-determined learning. Moreover, as Hanke and Sühl-Strohmenger stress, the motivation to learn will be high enough if the underlying objective is sufficiently strong.49 The formulations of learning objectives in the course and especially the students’ need and interest to use the online course, which can be taken for granted if the student applies for the voluntary online course, promotes (intrinsic) motivation.50
4.5. The medium and its technical circumstances
While the medium, in this context the learning management system Moodle, is predetermined to a large extendt by the host organization, the University of Duisburg-Essen, the course designer is responsible for the technical realization by using the modules of Moodle with respect to the learning objectives and methodology.
4.5.1. E-learning at the University of Duisburg-Essen
The University of Duisburg-Essen implemented an e-learning strategy for the period 2014 to 2020, which recommends using e-learning as an educational tool to improve the quality of teaching and learning.51 According to media-didactic concepts, supporting self-regulated learning is a major goal and may be realized by an online self-learning course. Moodle is administrated by the computer center of the university, the Centre for Information and Media Services, while the Moodle Centre of Excellence supports lecturers in didactical matters.52
4.5.2. Technical realization
In summer term 2016, the Duisburg-Essen University switched to Moodle 3.0.53 Since subject guides serve as blueprints for the presented online course, particularly to refer to external sources and the library’s collection, it was decided to use the following modules:
– Forum: The anonymous forum promotes asynchronous communication between the course participants themselves and with the course tutor. Of course, the users may address their questions directly to the course tutor via mail.
– Lessons: Lessons collect external content like videos and links, are connected through tutor-generated passages, and as a result, create learning pathways. Moreover, lessons contain simple quizzes to create attention, arouse interest and enable the user to self-audit comprehension of the lessons. The lessons are linked to the sources glossary to refer to the collection of the library without providing too detailed references information, which might overload the pages of the lessons.
– Feedback: The feedback is installed to generate a structured form of feedback by using survey questions. It allows to evaluate the course utilization and to record participants’ data like, e.g., subject of study and stage of studies.
– Text fields, text pages, and folders: Text fields and text pages are included into course topics to give structured and detailed information about a specific course section and to provide detailed resource lists regarding the content of the section. Folders collect self-made materials like examples to assess statistical information by using the presented criteria.
– Links: Links relate to external resources, especially stand-alone videos and recommended reviewed online tutorials.
– Wikis: The course contains wikis for databanks and for statistical analysis tools. Each wiki page ends with a collection of additional resources, especially with reference to the collection of the library.
– Glossary: The Glossary lists the references used in the online course. Furthermore, the resources are classified according to the categories (1) databases, datasets, and data portals, (2) glossaries and encyclopedias, (3) institutions and data providers, (4) textbooks, and (5) other sources, which enables users to browse in the glossary depending on their information needs.
Though Moodle provides a lot more tools in particular to enable collaboration between users, those tools were considered inappropriate in a self-study online course, where users work on diverse topics, in different contexts, with various backgrounds, and with diverse motivations. Hence, providing structured information referring to the collection and services of the library was adopted as the overarching learning scenario.
5. Critical judgment
Due to the fact that this project is based on the master program guidelines, it is not completed with the course design itself. The project still lacks three important steps, namely continuous improvement, evaluation, and marketing. Furthermore, the lack of detailed user evaluation might lead to questioning the quality and relevance of the course. Moreover, continuous improvement is needed if an extensive and complete educational service is aspired.54 Hence, the course will never be completely finished due to e.g. new databases, new additional library services, and supplementary training materials.
The broad marketing goal, which is „to encourage your users to think about the library when they think about data“55 and the specific marketing goal of popularizing the course, so that students requiring library assistance in writing an empirical paper know about this service, do not set up a marketing plan. Nevertheless, involving reference librarians and lecturers into the design and evaluation process is the first step to build up the relevant communication channels for promoting the course. Moreover, presentation of the course in lectures and seminars since the beginning of the winter term has led to lecturers and reference librarians advocating the course. They recommend it to their students and users, which implies knowledge regarding the existence of this course and acquisition of potential course users. A short brochure serves as a give-away after the consultation of reference librarians in the field of statistical information.
Regarding the Moodle tools used in the online course, there is still room for interactive features like additional and more detailed tests. Furthermore, the already included tests focus on learning by playing instead of assessing the students’ understanding. A test assessing the student’s information and statistical literacy level that refers to specific lessons and sections of the course would improve the student‘s learning outcome.
6. Conclusion and outlook
Statistics are a special kind of information. Hence, the users of this information should be able to read and evaluate it critically. Schools, colleges, and universities offer courses in statistical methodology, while libraries provide a wide range of statistical information through their collections or simply the internet. Still, especially German libraries do not seem to provide numeric data services filling the gaps between statistical information provision through databases and methodology, while e.g. American and British libraries support their users by creating subject guides or even statistical guides. The presented online course may arouse interest to install individual numeric data services in German university libraries, too. To facilitate activities, the course is available as an open educational resource.56
Reaching out to new target groups constitutes an additional aspect of evolution of numeric data services. For instance, scientific services like supporting research data management can be matched to the idea of QIL: Only if scientists know how to find, collect, merge, and describe data and especially to generate researchable and reusable information, the concept of research data management is beneficial. However, this target group requires diverse didactical decisions. Additionally, the course can be connected and adjusted for public libraries or scientific specialist libraries.
It is even conceivable to implement the course as a face-to-face workshop or blended learning module carried out in several meetings presenting databases, data evaluation, or data extraction methods into detail. Following the interest of one professor, a short master workshop on data research has already been carried out in winter term 2016 and will be repeated in winter term 2017 due to the positive feedback. Currently, 110 students are already using the course.57
All in all, it‘s the users that will show the true relevance and potential of numeric data services at Duisburg-Essen University Library, as only a consumed service is considered to be valuable and helpful.
List of References
– Association of College and Research Libraries. „Information Literacy Competency Standards for Higher Education.“ Accessed 2016-06-19. http://www.ala.org/acrl/standards/informationliteracycompetency.
– Best, Joel. Damned lies and statistics: Untangling nLies and Statistics: Untangling Numbers from the Media, Politicians, and Activists. Berkeley: University of California Press, 2001.
– Best, Joel. More Damned Lies and Statistics: How Numbers Confuse Public Issues. Berkeley: University of California Press, 2004.
– Bloom, Benjamin S. and Max D. Engelhart. Taxonomie von Lernzielen im kognitiven Bereich. Weinheim: Beltz, 1976.
– Bolton, Paul. Statistical Literacy Guide. Accessed 2016-06-13. http://researchbriefings.parliament.uk/ResearchBriefing/Summary/SN04944#fullreport.
– Dannenberg, Detlev. „In 10 Schritten zur Teaching Library.“ In The ne(x)t generation: Das Angebot der Bibliotheken. edited by Ute Bergner and Erhard Göbel, 144–50. Graz-Feldirch: Neugebauer, 2010.
– Deci, Edward L. und Richard M. Ryan. „Die Selbstbestimmungstheorie der Motivation und ihre Bedeutung für die Pädagogik.“ Zeitschrift für Pädagogik 39, Nr. 2 (1993): 223–238. Accessed 2017-02-01. https://www.phil-fak.uni-duesseldorf.de/fileadmin/Redaktion/Institute/Allgemeine_Sprachwissenschaft/Dokumente/Bilder/1993_DeciRyan_DieSelbstbestimmungstheoriederMotivation-German.pdf.
– Geraci, Diane, Chuck Humphrey and Jim Jacobs. Data Basics: An Introductory Text. Accessed 2016-06-17. http://3stages.org/class/2012/pdf/data_basics_2012.pdf.
– Haack, Dennis G. Statistical Literacy: A Guide to Interpretation. Belmont, California: Duxbury Press, 1979.
– Hanke, Ulrike and Wilfried Sühl-Strohmenger. Bibliotheksdidaktik: Grundlagen zur Förderung von Informationskompetenz. Berlin: De Gruyter Saur, 2015. http://dx.doi.org/10.1515/9783110352559.
– Homann, Benno. „Das Dynamische Modell der Informationskompetenz (DYMIK) als Grundlage für bibliothekarische Schulungen.“ In Informationskompetenz: Basiskompetenz in der Informationsgesellschaft, edited by Gerhard Knorz and Rainer Kuhlen, 195–205. Konstanz: UVK, 2000. Accessed 2017-02.01. https://epub.uni-regensburg.de/11032/.
– Kellam, Lynda M. and Katharin Peter. Numeric Data Services and Sources for the General Reference Librarian. Witney: Chandos Publishing, 2011. Accessed 2017-02.01. http://www.sciencedirect.com/science/book/9781843345800.
– Kerres, Michael. Mediendidaktik: Konzeption und Entwicklung mediengestützter Lernangebote. München: Oldenbourg, 2013. http://dx.doi.org/10.1524/9783486736038.
– Kläre, Christina. „Informationskompetenzvermittlung Reloaded: Das Komplement Statistical Literacy.“ Presented at the 105. Deutscher Bibliothekartag in Leipzig 2016 = 6. Bibliothekskongress, Leipzig, 2016-03-16. https://opus4.kobv.de/opus4-bib-info/frontdoor/index/index/docId/2377.
– Krämer, Walter. So lügt man mit Statistik. Frankfurt am Main: Campus, 2015.
– Niegemann, Helmut M. „Besonderheiten einer Didaktik des E-Learning.“ In eLearning-Didaktik, edited by Rolf Arnold and Markus Lermen, 65–74. Baltmannsweiler: Schneider, 2006.
– Nuerk, Hans-Christoph, Joachim Engel and Laura Martignon. „Statistical Literacy: Eine Basiskompetenz in der Informationsgesellschaft.“ Lernen und Lernstörungen 4, Nr. 2 (2015): 85–90. http://dx.doi.org/10.1024/2235-0977/a000097.
– Piaget, Jean, Reinhard Fatke and Hainer Kober. Meine Theorie der geistigen Entwicklung. Weinheim: Beltz, 2014.
– Reinmann-Rothmeier, Gabi, Frank Vohle, Frederic Adler and Heidi Faust. Didaktische Innovation durch Blended Learning: Leitlinien anhand eines Beispiels aus der Hochschule. Bern: Huber, 2003.
– Rinne, Horst. Taschenbuch der Statistik. Frankfurt am Main: Deutsch, 2008.
– Shield, Milo. „Information Literacy, Statistical Literacy and Data Literacy.“ IASSIST Quarterly 28, 2-3 (2004): 6–11. Accessed 2017-02.01. http://www.iassistdata.org/sites/default/files/iqvol282_3shields.pdf.
– Society of College, National and University Libraries. Information Skills in Higher Education. Accessed 2016-06-25. http://www.sconul.ac.uk/sites/default/files/documents/Seven_pillars2.pdf.
– United Nations. Making Data Meaningful Part 4: A Guide to Improving Statistical Literacy. 2012. Accessed 2017-02.02. https://www.unece.org/fileadmin/DAM/stats/documents/writing/Making_Data_Meaningful_Part_4_for_Web.pdf.
– Wallman, Katherine K. „Enhancing Statistical Literacy: Enriching Our Society.“ Journal of the American Statistical Association 88, Nr. 421 (1993): 1–8. http://dx.doi.org/10.2307/2290686.
1 The paper and the presented online course have been developed within the study program of MALIS – Master of Library and Information Sciences – at Technische Hochschule Köln supervised by Professor Doctor Inka Tappenbeck. See also Christina Kläre, „Quantitative Informationskompetenz steigern – ein Online-Kurs zur Datenkompetenz,“ MALIS Projekte-Blog, November 21, 2016, accessed 2017-02-16, http://malisprojekte.web.th-koeln.de/wordpress/quantitative-informationskompetenz-steigern-ein-online-kurs-zur-datenkompetenz/.
2 Joel Best, More Damned Lies and Statistics: How Numbers Confuse Public Issues (Berkeley: University of California Press, 2004), 24.
3 Cf. Joel Best, Damned Lies and Statistics: Untangling Numbers from the Media, Politicians, and Activists (Berkeley: University of California Press, 2001).
4 btw, „positive“ does not refer to valuing the attitude but to the opposite pole of distrusting statistics.
5 For more information about the Bielefeld University of Applied Sciences Library’s learning services see „Learning Services,“ Fachhochschule Bielefeld, accessed 2016-11-05, https://www.fh-bielefeld.de/learningservices.
6 Detailed information about the Master program are presented at „Bibliotheks- und Informationswissenschaft (Master),“ Technische Hochschule Köln, accessed 2016-11-05, https://www.th-koeln.de/studium/bibliotheks--und-informationswissenschaft-master_3202.php.
7 For the presentation see Christina Kläre, „Informationskompetenzvermittlung Reloaded: Das Komplement Statistical Literacy,“ (presented at the 105. Deutscher Bibliothekartag in Leipzig 2016 = 6. Bibliothekskongress, Leipzig, 2016-03-16), https://opus4.kobv.de/opus4-bib-info/frontdoor/index/index/docId/2377.
8 Though information literacy is also a topic in further types of libraries, this article focuses on the college and university libraries, as the described online course was designed for a university library.
9 Cf. „Information Literacy Competency Standards for Higher Education,“ Association of College and Research Libraries, accessed 2016-06-19, http://www.ala.org/acrl/standards/informationliteracycompetency.
10 Cf. „Information Literacy,“ Student Learning & Information Literacy Committee, accessed 2016-06-15, http://www.ala.org/acrl/issues/infolit.
11 Cf. Society of College, National and University Libraries, Information Skills in Higher Education (Advisory Committee on Information Literacy, 1999), accessed 2016-06-25, http://www.sconul.ac.uk/sites/default/files/documents/Seven_pillars2.pdf.
12 Cf. Council of Australian University Librarians, Information Literacy Standards (Canberra: Council of Australian University Librarians, 2001), http://www.caul.edu.au/caul-programs/information-literacy/publications.
13 Cf. Dienstleistungskommission des Deutschen Bibliotheksverbands, Standards der Informationskompetenz für Studierende (2009), accessed 2016-03-12, http://www.bibliotheksverband.de/fileadmin/user_upload/Kommissionen/Kom_Dienstleistung/Publikationen/Standards_Infokompetenz_03.07.2009_endg.pdf.
14 Cf. especially ibid.
15 The International Association for Statistical Education is the education section of the International Statistical Institute, see International Association for Statistical Education (IASE), accessed 2016-11-05, http://iase-web.org/.
16 „ISLP strategy project,“ IASE, accessed 2016-06-16, http://iase-web.org/islp/Activities.php?p=Strategy_Project.
17 Ibid.
18 Katherine K. Wallman, „Enhancing Statistical Literacy: Enriching Our Society,“ Journal of the American Statistical Association 88, Nr. 421 (1993): 1, http://dx.doi.org/10.2307/2290686.
19 Cf. Hans-Christoph Nuerk, Joachim Engel and Laura Martignon, „Statistical Literacy: Eine Basiskompetenz in der Informationsgesellschaft,“ Lernen und Lernstörungen 4, Nr. 2 (2015): 87, http://dx.doi.org/10.1024/2235-0977/a000097.
20 Milo Shield, „Information Literacy, Statistical Literacy and Data Literacy,“ IASSIST Quarterly 28, 2-3 (2004): 8, http://www.iassistdata.org/sites/default/files/iqvol282_3shields.pdf.
21 Cf. ibid., 6.
22 Cf. Horst Rinne, Taschenbuch der Statistik, (Frankfurt am Main: Deutsch, 2008), 1.
23 Diane Geraci, Chuck Humphrey and Jim Jacobs, Data basics: An Introductory Text (2012), 1.1, accessed 2016-06-17, http://3stages.org/class/2012/pdf/data_basics_2012.pdf.
24 Cf. „Finding data & statistics,“ UC San Diego Library, accessed 2016-06-13, http://ucsd.libguides.com/data-statistics.
25 Cf. „Resources for data analysis,“ Northwestern University Library, accessed 2016-06-13, http://libguides.northwestern.edu/c.php?g=114906.
26 Cf. „Statistics: Getting started,“ Curtin University Library, accessed 2016-06-13, http://libguides.library.curtin.edu.au/statistics.
27 Cf. „Statistical consulting,“ Kent State University Libraries, accessed 2016-06-13, http://libguides.library.kent.edu/statc.
28 Cf. „Reference desk: Statistics,“ Oxford Brookes University Library, accessed 2017-02-01, https://www.brookes.ac.uk/Library/Resources/Statistics/.
29 Cf. Paul Bolton, Statistical literacy guide (2009), accessed 2016-06-13, http://researchbriefings.parliament.uk/ResearchBriefing/Summary/SN04944#fullreport.
30 Cf. United Nations, Making Data Meaningful Part 4: How to improve statistical literacy: A guide for statistical organizations (2012), accessed 2016-06-18, http://www.unece.org/fileadmin/DAM/stats/publications/2013/Making_Data_Meaningful_4.pdf.
31 Shield, Information literacy, statistical, 9.
32 Cf. Michael Kerres, Mediendidaktik: Konzeption und Entwicklung mediengestützter Lernangebote (München: Oldenbourg, 2013), 217, http://dx.doi.org/10.1524/9783486736038.
33 „Library success: A best practices wiki, entry for ‘subject guides’,“ Meredith Farkas, accessed 2016-06-17, http://www.libsuccess.org/Subject_Guides.
34 Cf. Universität Duisburg-Essen, Daten und Fakten/Facts and Figures (2015), accessed 2016-06-18, https://www.uni-due.de/imperia/md/content/dokumente/datenundfakten/daten_und_fakten.pdf.
35 Access to the World Bank’s World DataBank via „World DataBank,“ The World Bank, accessed 2016-11-05, http://databank.worldbank.org/data/home.aspx.
36 Cf. Benno Homann, „Das Dynamische Modell der Informationskompetenz (DYMIK) als Grundlage für bibliothekarische Schulungen,“ in Informationskompetenz: Basiskompetenz in der Informationsgesellschaft, ed. Gerhard Knorz and Rainer Kuhlen (Konstanz: UVK, 2000), 195–205, https://epub.uni-regensburg.de/11032/.
37 Cf. „Information literacy competency standards for higher education.“
38 Diane Geraci, Chuck Humphrey and Jim Jacobs, Data basics: An introductory text, accessed 2016-06-17, http://3stages.org/class/2012/pdf/data_basics_2012.pdf; Lynda M. Kellam and Katharin Peter, Numeric data services and sources for the general reference librarian (Witney: Chandos Publishing, 2011), http://www.sciencedirect.com/science/book/9781843345800; Dennis G. Haack, Statistical literacy: A guide to interpretation (Belmont: Duxbury Press, 1979).
39 Cf. Jean Piaget, Reinhard Fatke and Hainer Kober, Meine Theorie der geistigen Entwicklung (Weinheim: Beltz, 2014), 53 ff.
40 Cf. Helmut M. Niegemann, „Besonderheiten einer Didaktik des E-Learning,“ in eLearning-Didaktik, ed. Rolf Arnold and Markus Lermen (Baltmannsweiler: Schneider, 2006), 65–74, 67 f.
41 Cf. Gabi Reinmann-Rothmeier et al., Didaktische Innovation durch Blended Learning: Leitlinien anhand eines Beispiels aus der Hochschule (Bern: Huber, 2003), 36.
42 Cf. Kerres, Mediendidaktik, 231.
43 Cf. Benjamin S. Bloom and Max D. Engelhart, Taxonomie von Lernzielen im kognitiven Bereich (Weinheim: Beltz, 1976).
44 Cf. Ulrike Hanke and Wilfried Sühl-Strohmenger, Bibliotheksdidaktik: Grundlagen zur Förderung von Informationskompetenz (Berlin: De Gruyter Saur, 2015). http://dx.doi.org/10.1515/9783110352559, 103 ff.
45 Cf. ibid., 139.
46 Cf. Helmut M. Niegemann, „Besonderheiten einer Didaktik,“ 73.
47 Cf. Edward L. Deci and Richard M. Ryan, „Die Selbstbestimmungstheorie der Motivation und ihre Bedeutung für die Pädagogik,“ Zeitschrift für Pädagogik 39, Nr. 2 (1993): 223–238, accessed 2017-02-01, https://www.phil-fak.uni-duesseldorf.de/fileadmin/Redaktion/Institute/Allgemeine_Sprachwissenschaft/Dokumente/Bilder/1993_DeciRyan_DieSelbstbestimmungstheoriederMotivation-German.pdf.
48 Hanke and Sühl-Strohmenger, Bibliotheksdidaktik, 128.
49 Ibid., 90.
50 Ibid.
51 Cf. Universität Duisburg-Essen, E-Learning-Strategie (2014), 2 ff., accessed 2016-06-25, https://www.uni-due.de/imperia/md/content/e-learning/strategie/e-learning-strategie.pdf.
52 Ibid, 6.
53 Cf. „Moodle Knowledgebase: Stichwort Überblick,“ Universität Duisburg-Essen, accessed 2016-06-18, https://wiki.uni-due.de/moodle/index.php/%C3%9Cberblick.
54 Cf. Detlev Dannenberg, „In 10 Schritten zur Teaching Library,“ in The ne(x)t generation: Das Angebot der Bibliotheken, ed. Ute Bergner and Erhard Göbel (Graz-Feldirch: Neugebauer, 2010), 144–50.
55 Kellam and Peter, Numeric Data Services, 51.
56 The Moodle files are available at „DuEPublico,“ Universität Duisburg-Essen, accessed 2017-02-16, https://duepublico.uni-duisburg-essen.de/servlets/DocumentServlet?id=43453.
57 Enrollment rate status as at January 24, 2017.
